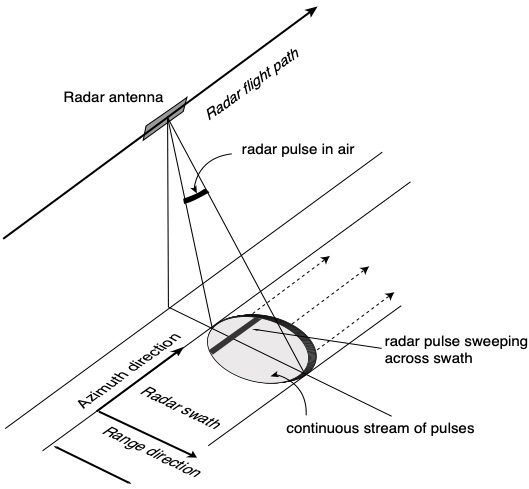
8 SAR
Source: NASA
Synthetic Aperture Radar (SAR) is a technology with broad prospects. As an active sensor, SAR is capable of detecting the Earth’s surface at any time of day and under any cloud conditions. Compared to traditional optical imaging systems, SAR’s unique advantages include its all-weather, day-and-night operational capability, making it indispensable for emergency response and scientific research.
8.1 Summary
| KEY ASPECT | DESCRIPTION |
|---|---|
| SAR in Flood Analysis | Sentinel-1 SAR data helps identify flood areas by distinguishing calm water from rough surfaces based on radar reflection. |
| SAR Fundamentals | SAR uses electromagnetic backscatter to penetrate clouds and weather, with synthetic aperture techniques enhancing resolution. |
| SAR Polarization | SAR polarization affects signal backscatter, with different polarizations (VV, VH/HV, HH) sensitive to various surface characteristics. |
| Change Detection with SAR | Utilizes differential interferometry and data fusion for ground movement analysis and environmental monitoring, emphasizing appropriate scale selection. |
| Statistical Tests and Image Fusion | Employs statistical tests and fusion techniques to combine SAR and optical data for comprehensive analysis, focusing on environmental changes. |
8.1.1 Interpreting Radar Images
Source: Alaska Satellite Facility (ASF)
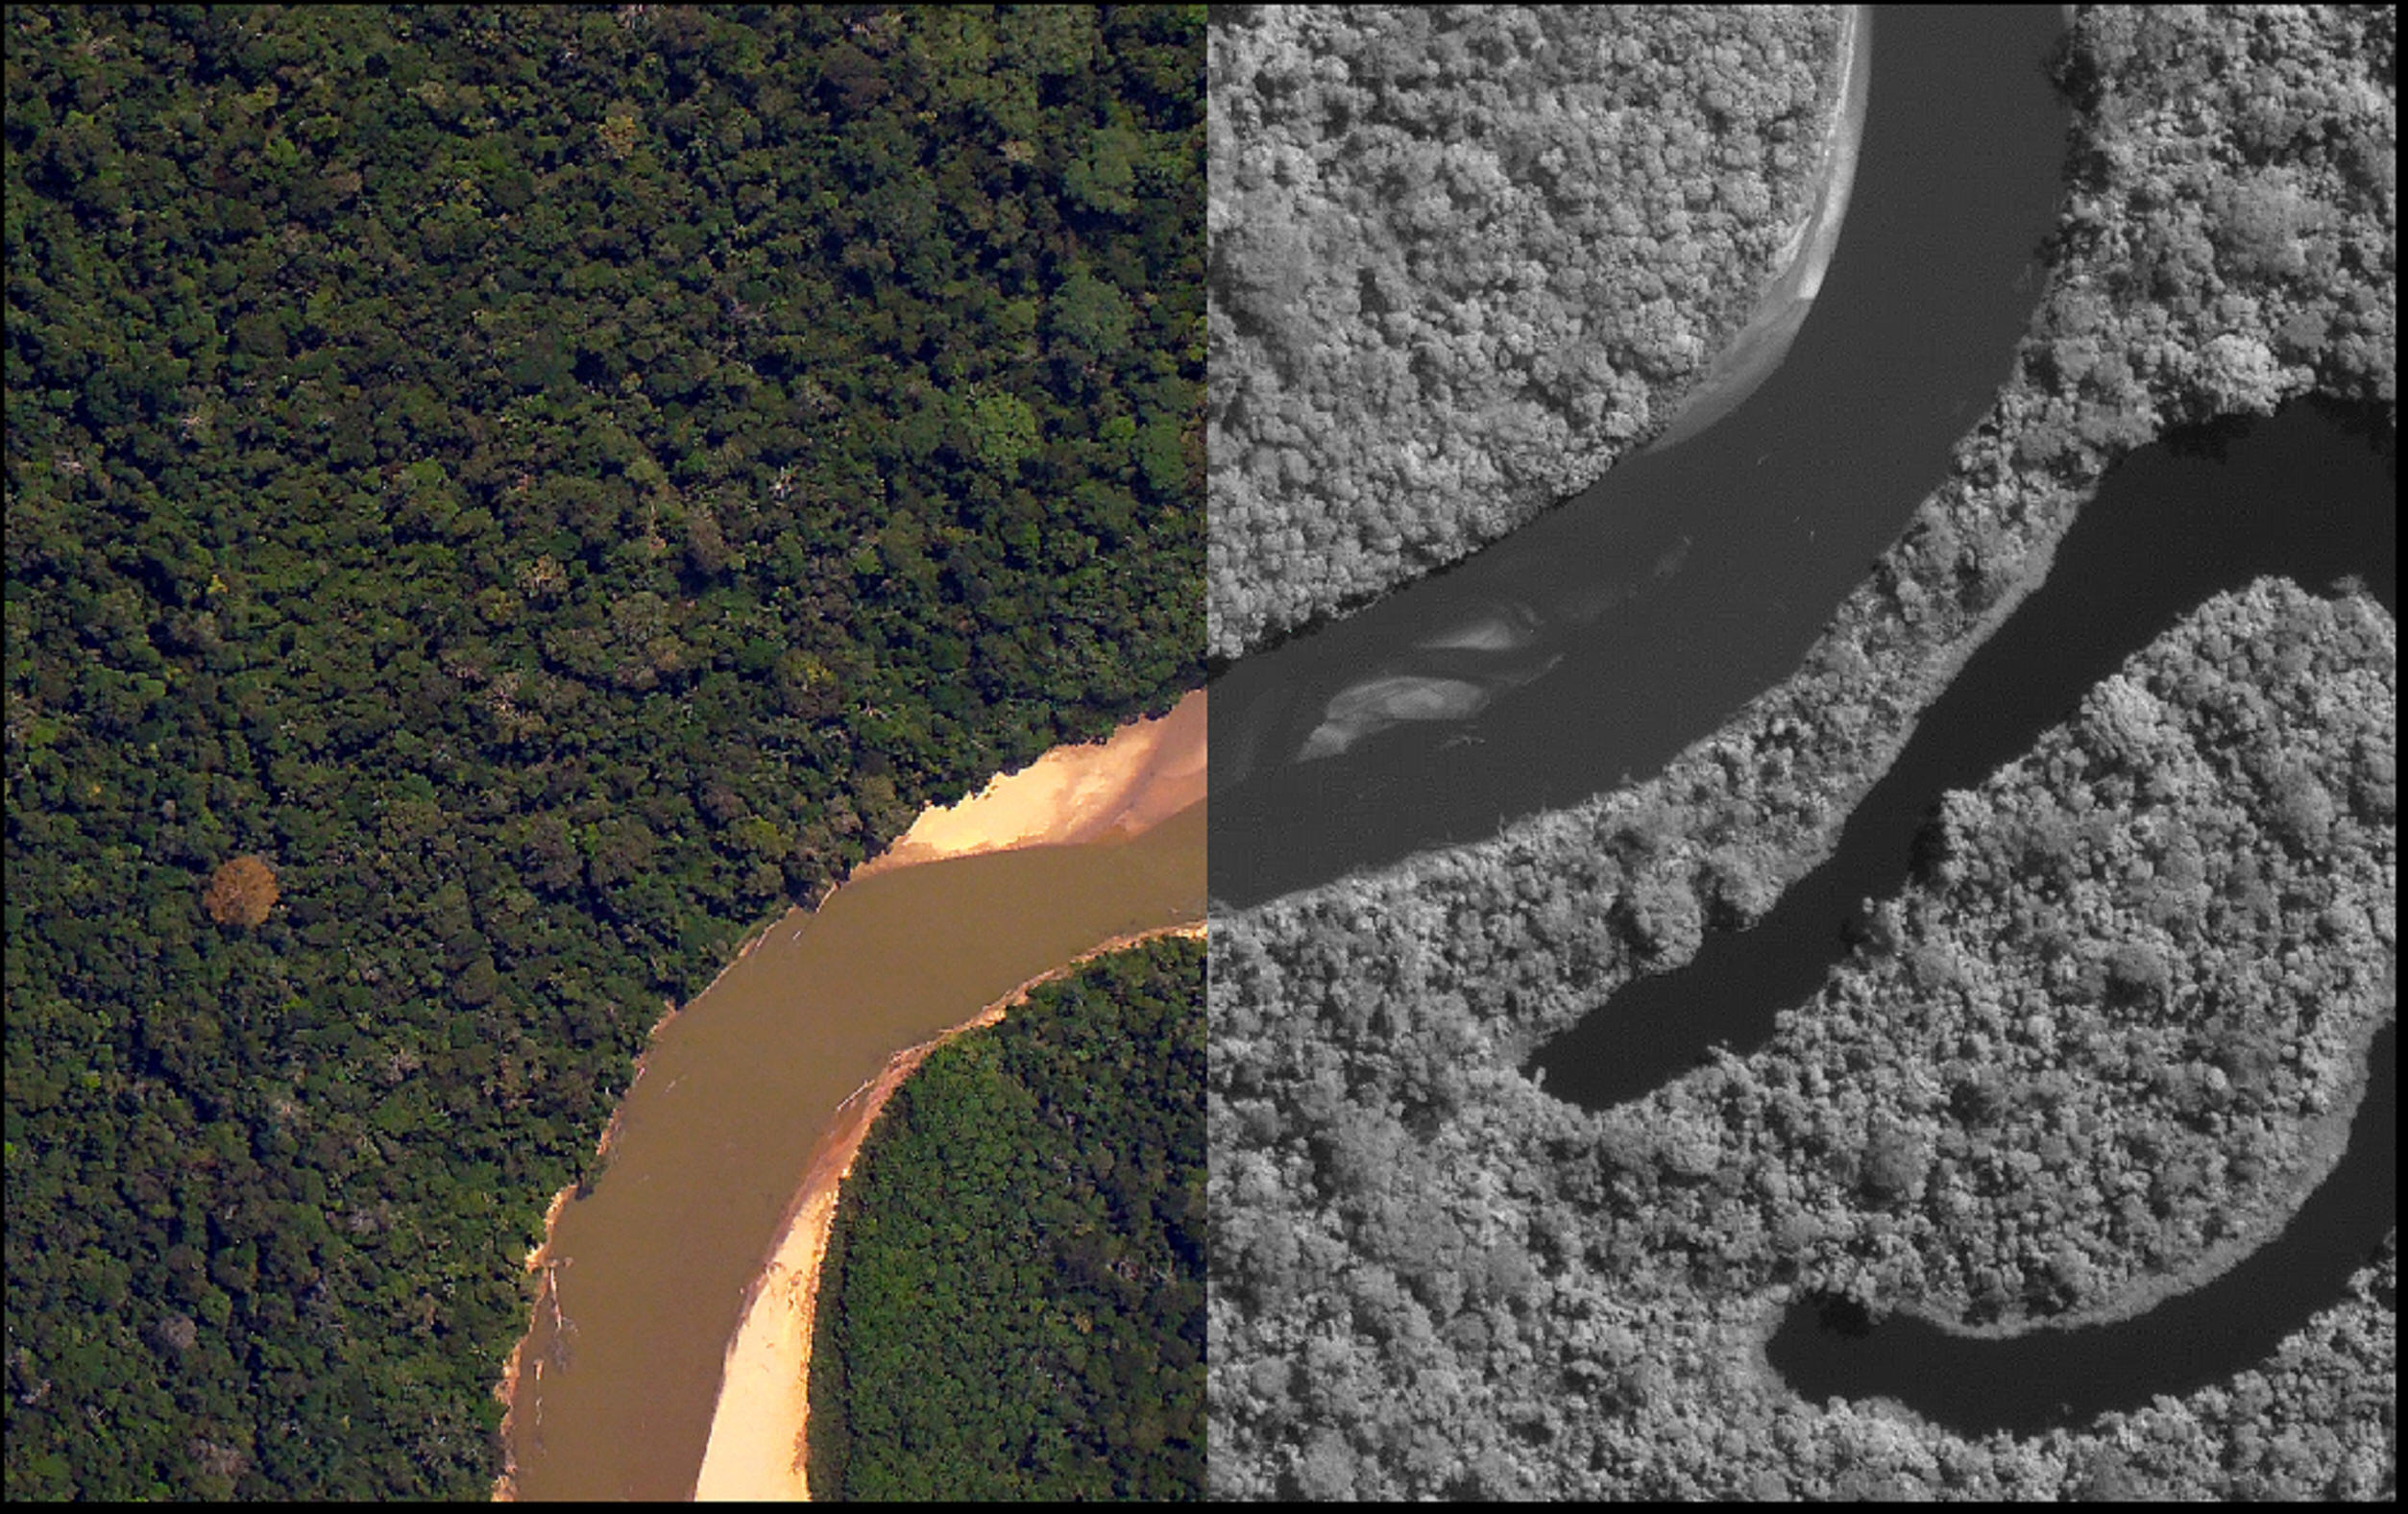
Smooth surfaces like calm water appear dark because radar pulses reflect away.
Rough or wet surfaces are brighter due to more scattered radar waves.
Slopes cause geometric distortions; steeper slopes result in more pronounced layover, with mountaintops appearing tilted towards the sensor.
Specific polarization choices can highlight terrain features.
In urban areas, buildings aligned perpendicular to the flight direction reflect strongly.
Surface features near the radar’s wavelength size cause strong backscatter.
Large-scale terrain variations lead to one side appearing bright and the other dim.
Man-made structures like buildings act as corner reflectors, appearing as bright spots in SAR images, especially corner reflectors and calibration instruments, which can produce a bright cross in the processed images.
8.1.2 SAR in Flood Analysis
- Flood Detection: By analyzing SAR data from satellites like Sentinel-1, scientists can distinguish calm water surfaces from rough ones based on radar reflection differences, identifying flood areas. Specific cases have demonstrated the successful assistance of SAR data in flood management and disaster response, showcasing its practical application value.
8.1.3 SAR Fundamentals
Operational Principle: SAR systems emit electromagnetic signals and capture the backscatter to map the Earth’s surface. This signal varies with surface conditions and can see through weather and cloud cover.
Synthetic Aperture: Through signal processing, SAR simulates a longer antenna, achieving higher resolution imaging, crucial for detailed surface analysis and monitoring changes over time.
Frequency Bands: Different frequency bands (e.g., X, C, L, P) are crucial for SAR applications, as each band has different penetration capabilities and is suited for various observation needs.
8.1.4 SAR Polarization
- Surface Interaction: Different SAR polarizations (VV, VH/HV, HH) respond differently to backscatter, significantly affecting how SAR images various surfaces. VV polarization is sensitive to surface roughness, VH or HV is ideal for volume scattering (e.g., foliage), and HH polarization is best for double-bounce surfaces (e.g., urban structures). This diversity in response aids in detailed environmental and urban studies.
8.1.5 Change Detection with SAR
Differential Interferometry (DInSAR): Provides a method for tracking ground movements, vital for geological and infrastructure monitoring.
Data Fusion: Combining SAR with optical data offers a multifaceted view of environmental changes. Selecting the correct scale (power, amplitude, dB) is crucial for accurate analysis and visualization, enhancing SAR data interpretability.
8.1.6 Statistical Tests and Image Fusion
Statistical Analysis: Applying statistical tests such as t-tests and standard deviation to detect temporal changes in SAR data highlights SAR’s utility in change detection.
Image Fusion Techniques: Exploring techniques like Principal Component Analysis and Intensity Fusion to merge SAR with optical data, providing comprehensive insights into environmental conditions and changes, thereby broadening the scope of remote sensing applications.
8.2 Applications
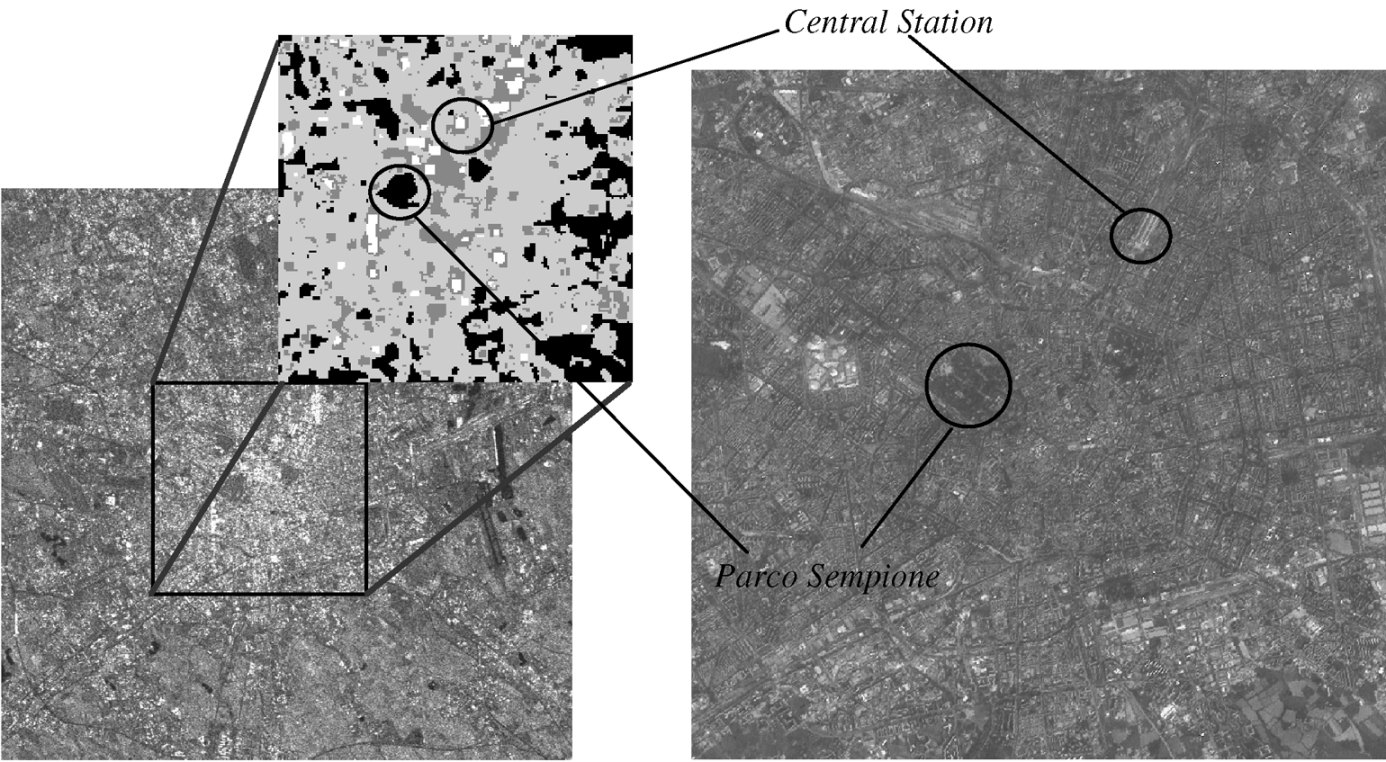
8.2.1 Texture-Based Characterization of Urban Environments Using SAR
The research conducted by Dell’Acqua and Gamba (2003) explores the potential of co-occurrence texture measures for enhancing the classification of urban areas in SAR imagery. This approach allows for a more nuanced analysis of urban structures, identifying variations in building density within the town of Pavia, Northern Italy. By integrating texture measures with SAR data, the study opens new avenues for urban planning and development monitoring, showcasing SAR’s capability to provide detailed insights into the urban fabric.
Methodology and Findings
Utilizing a series of ERS-1 images of Pavia and applying co-occurrence texture analysis, the researchers were able to discern different urban densities with improved accuracy. The study emphasizes the importance of selecting the appropriate window size for texture measures and identifies key texture parameters that significantly aid in the urban classification process. This methodology highlights SAR’s adaptability in urban studies, especially in scenarios where high-resolution optical data may not be available or sufficient.
Practical Implications
The findings from Dell’Acqua and Gamba’s work illustrate SAR’s effectiveness in urban density mapping, providing valuable data for urban planners and environmental scientists. By enabling a refined analysis of urban areas, SAR imagery, when coupled with texture analysis, facilitates the identification of residential, industrial, and suburban zones, thereby supporting informed decision-making in urban development and land use planning.
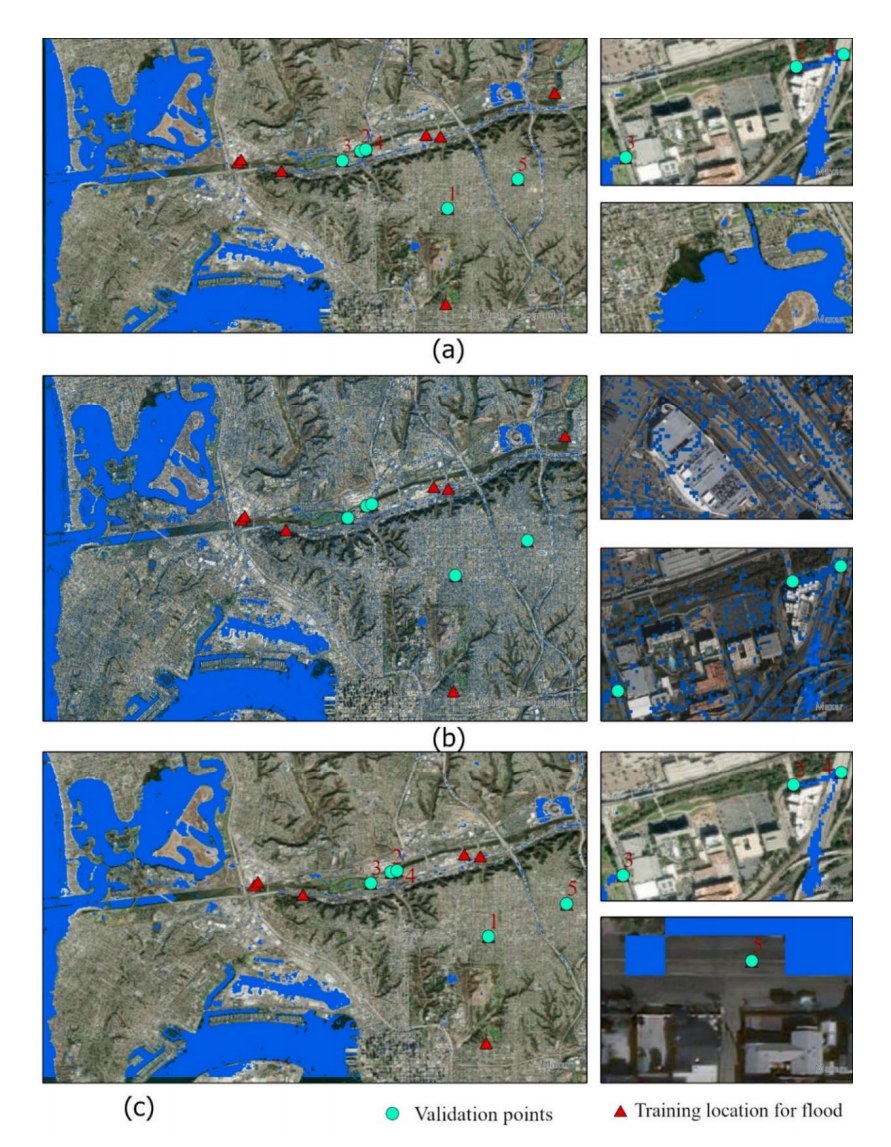
8.2.2 Urban Flood Detection in San Diego
A significant instance of the practical application of SAR technology, enhanced with machine learning, is found in the study conducted in San Diego, California, by Tanim et al. (2022). This research illustrates the potential of integrating SAR imagery with advanced machine learning algorithms to detect and map urban flooding accurately.
Methodology Overview:
Data Preparation: The study utilized Sentinel-1 SAR imagery, which was processed to improve signal quality for flood detection. This preprocessing involved correcting for atmospheric disturbances and noise to ensure the integrity of the data used for analysis.
Machine Learning Integration: To distinguish between water and non-water areas within the urban landscape, the study employed several machine learning models, including Random Forest (RF), Support Vector Machine (SVM), and Maximum Likelihood Classifier (MLC). These models, both supervised and unsupervised, were trained and tested on the processed SAR data to accurately identify flooded and non-flooded regions.
Flood Detection and Mapping: Leveraging SAR imagery alongside machine learning enabled the rapid identification of flooded areas. By analyzing differences in radar backscatter, which vary significantly between water surfaces and other types of land cover, the models were capable of precisely mapping the extent of urban flooding.
This approach demonstrates an advanced methodology for urban flood detection, utilizing SAR’s capabilities in scenarios where optical sensors might be impeded by cloud cover or nighttime conditions.
Implications for Urban Planning:
The study’s findings provide essential insights for urban planners and emergency response teams by identifying potential flood-prone zones and offering actionable data to mitigate the impact of flooding in urban settings. The capacity for quick and accurate flood extent mapping significantly enhances disaster preparedness and response strategies, contributing to the resilience of urban infrastructure against flood risks.
8.3 Reflection
This week’s exploration into Synthetic Aperture Radar (SAR) has been profoundly enlightening, unveiling the extensive capabilities and diverse applications of SAR in the realm of remote sensing. Understanding the critical differences between active and passive sensors, coupled with deep insights into SAR’s pivotal role in environmental monitoring—especially in flood analysis—has laid a robust foundation in my comprehension of SAR technology. Delving into the nuances of SAR polarization and its effects on surface analysis significantly expanded my appreciation of the intricate ways in which various materials interact with SAR signals. Furthermore, engaging discussions on change detection methodologies and the integration of SAR with optical data have opened up new horizons for conducting thorough environmental analyses. Importantly, this journey through SAR’s intricacies has sparked inspiration for my dissertation on conducting flood risk assessment, presenting a clear path forward in harnessing SAR’s potential to enhance our understanding and management of flood risks.
8.4 References
Alaska Satellite Facility, 2019. How do I interpret SAR images? [online] Available at: https://asf.alaska.edu/information/sar-information/how-do-i-read-sar-images/
Dell’Acqua, F., and Gamba, P. (2003). Texture-Based Characterization of Urban Environments on Satellite SAR Images. IEEE Transactions on Geoscience and Remote Sensing, 41(1), pp. 153–159.
Tanim, A.H., McRae, C.B., Tavakol-Davani, H. and Goharian, E. (2022). Flood Detection in Urban Areas Using Satellite Imagery and Machine Learning. *Water*, 14(7), p.1140. Available at: https://doi.org/10.3390/w14071140.